Performance
If you would like to see how we compare to other local schools please follow the link. You can go directly to Worplesdon Primary School's performance page here.
Please note, no primary test or assessment data has been published for 2020, 2021 or 2022.
Key Stage 2 Data
Attainment
Children’s results are reported using a scaled score. A scaled score of 100 represents the expected standard for each test. A child achieving a scaled score of 100 or more means they are working at or above the expected standard in the subject. Less than 100 means that they may need more support to reach the expected standard. The highest scaled score possible at KS2 is 120, and the lowest is 80. There is more information on scaled scores at: www.gov.uk/guidance/scaled-scores-at-key-stage-2. Scaled score averages are provisional and full data is published on DfE website in April every year.
Progress
Scores for Reading, Writing and Maths will be centred around 0, with most schools within the range of -5 to +5.
- A score of 0 means pupils in this school on average do about as well at KS2 as those with similar prior attainment nationally.
- A positive score means pupils in this school on average do better at KS2 as those with similar prior attainment nationally and a negative score means pupils in this school on average do worse at KS2 as those with similar prior attainment nationally.
2023 - 2024
Percentage of Pupils Achieving the Expected Standard or Above
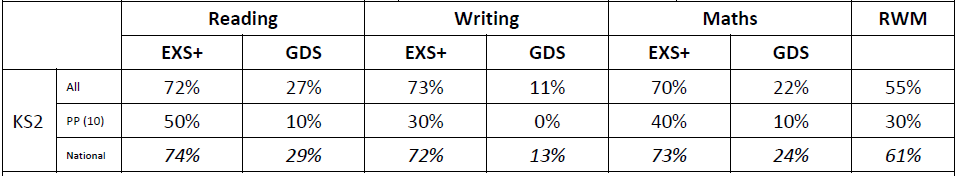
Percentage of Pupils Achieving a Higher Level of Attainment
|
Subject |
Attainment | |
|---|---|---|
| School |
National (2024) |
|
| Reading | 27% | 29% |
| Writing | 11% | 13% |
| Maths | 22% | 24% |
| Combined Reading Writing & Maths | 55% | 61% |